BiocircuitsUniversity of Seville
Home / Sources and credits

Sources and credits

Institutional records, research images and author portraits used on this website.

Institutional sources

The regional TIC-178 register lists the broader mixed-signal integrated circuit design and test group. The Institute of Microelectronics of Seville maintains a separate directory for Biomedical Circuits and Systems. Individual affiliations and research contributions are documented on the People and Projects pages.

Research images

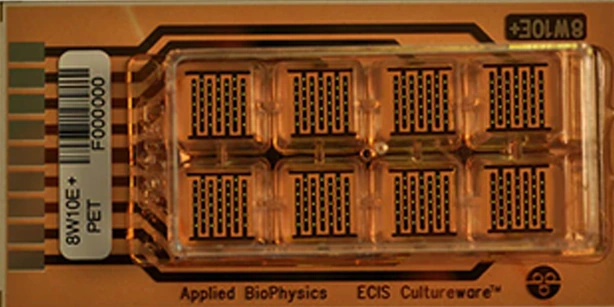
Detail of the 8W10E+ culture plate with gold microelectrodes used in the electrical stimulation experiments.

Detail of the 8W10E+ culture plate with gold microelectrodes used in the electrical stimulation experiments.

Daniel Martín, J. Bocio-Nuñez, Santiago F. Scagliusi, Pablo Pérez, Gloria Huertas, Alberto Yúfera, Mercè Giner, and Paula Daza. Cropped from Figure 1B.
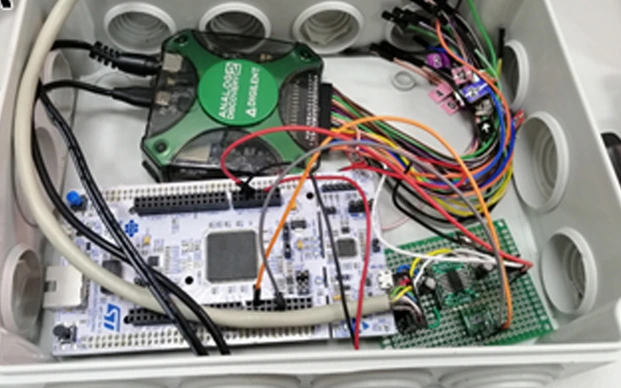
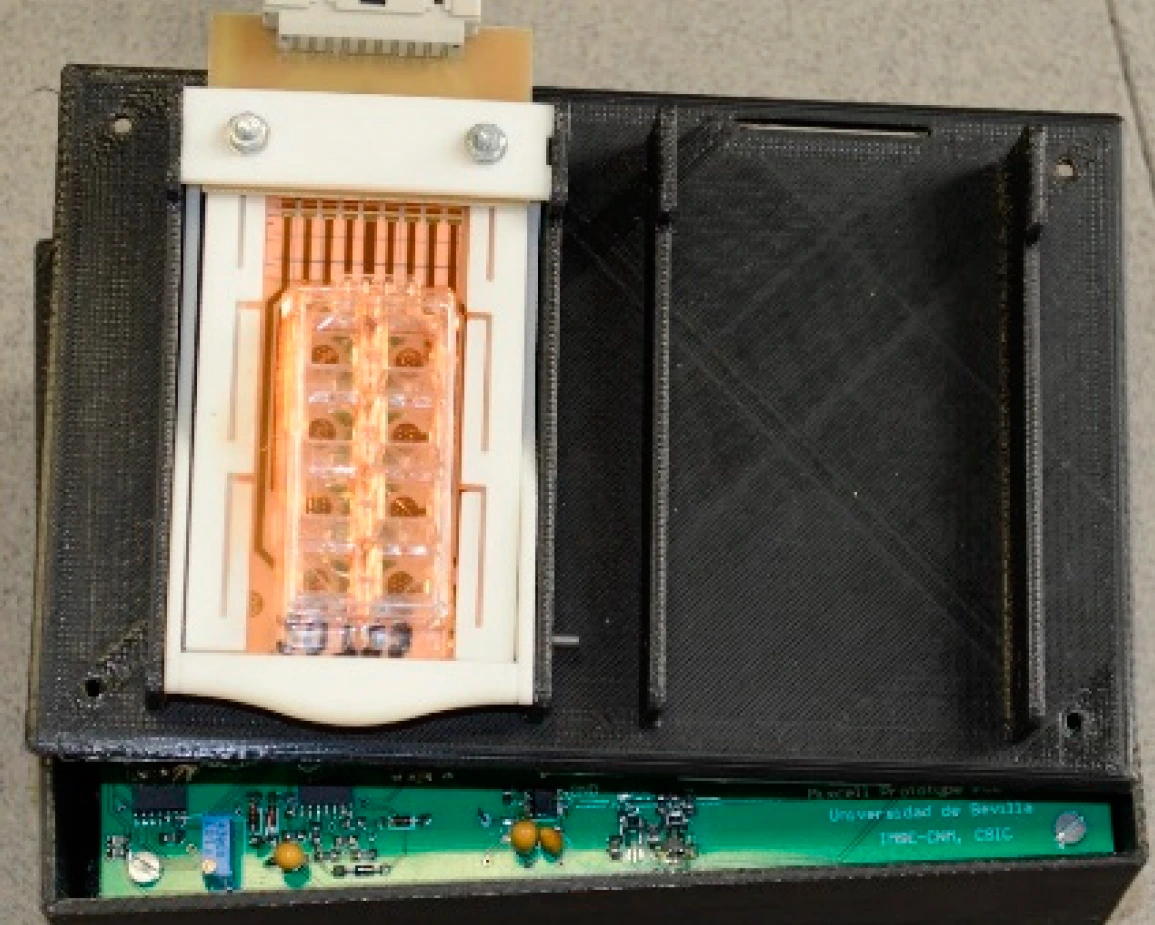
Circuitry inside the electrical stimulation system for cell cultures.

Circuitry inside the electrical stimulation system for cell cultures.

Daniel Martín, J. Bocio-Nuñez, Santiago F. Scagliusi, Pablo Pérez, Gloria Huertas, Alberto Yúfera, Mercè Giner, and Paula Daza. Cropped from the photograph in Figure 1A.

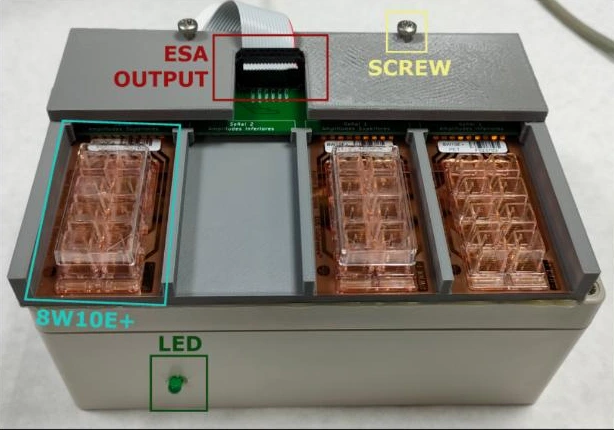
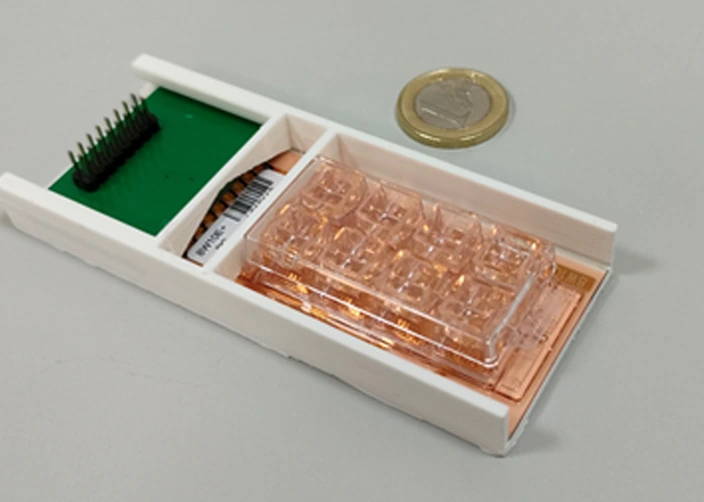
Culture plate and connector board mounted in a 3D-printed holder.

Culture plate and connector board mounted in a 3D-printed holder.

Daniel Martín, J. Bocio-Nuñez, Santiago F. Scagliusi, Pablo Pérez, Gloria Huertas, Alberto Yúfera, Mercè Giner, and Paula Daza. Cropped from Figure 1C.

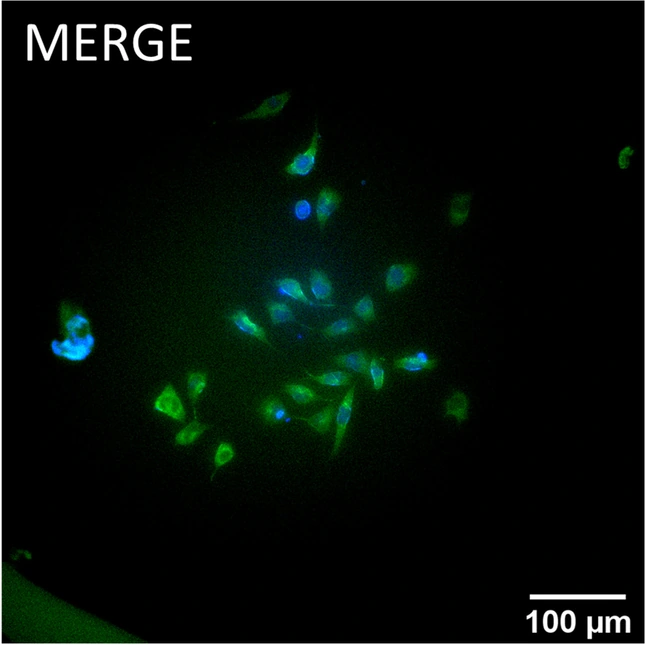
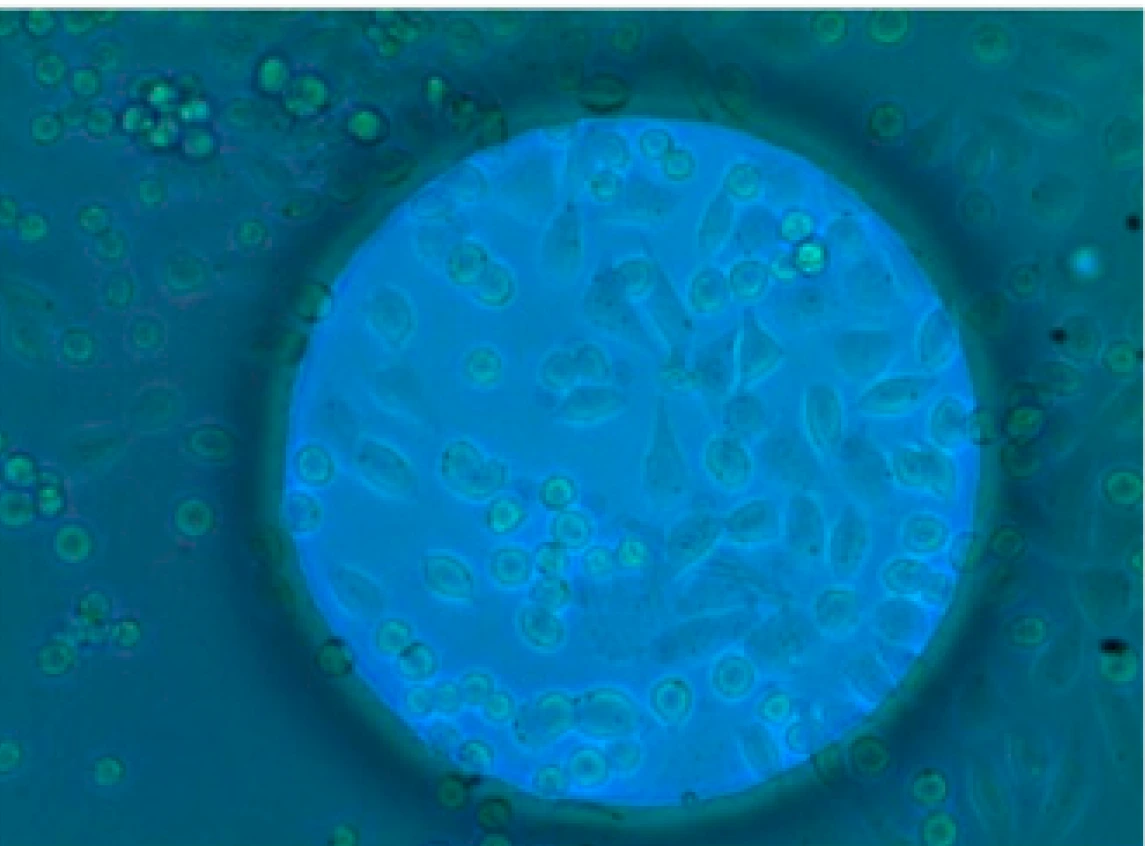
Immunofluorescence image of N2a cells after six hours of electrical stimulation. Tubulin is shown in green and cell nuclei in blue.

Immunofluorescence image of N2a cells after six hours of electrical stimulation. Tubulin is shown in green and cell nuclei in blue.

Daniel Martín, J. Bocio-Nuñez, Santiago F. Scagliusi, Pablo Pérez, Gloria Huertas, Alberto Yúfera, Mercè Giner, and Paula Daza. Merged fluorescence panel from Figure 5.

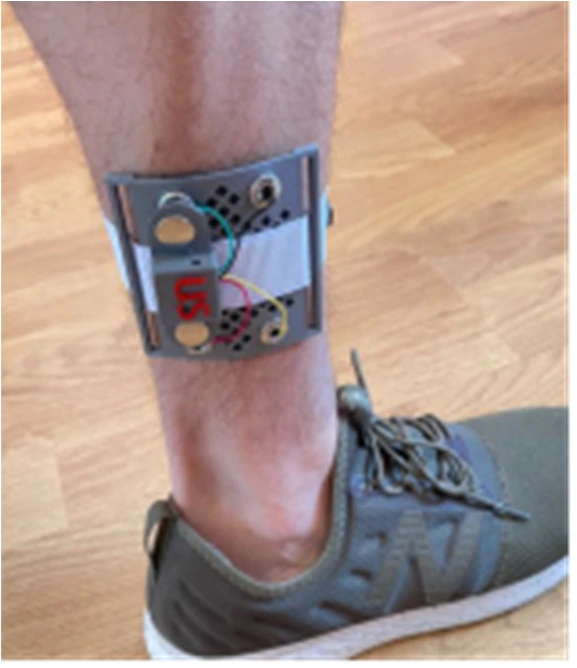
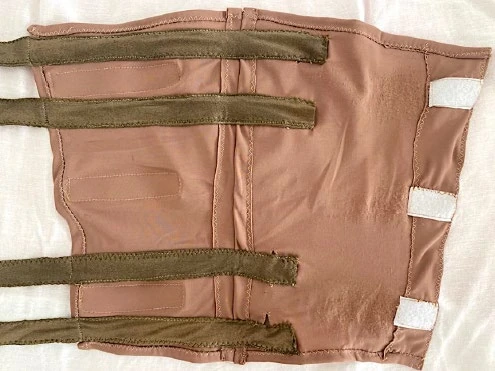
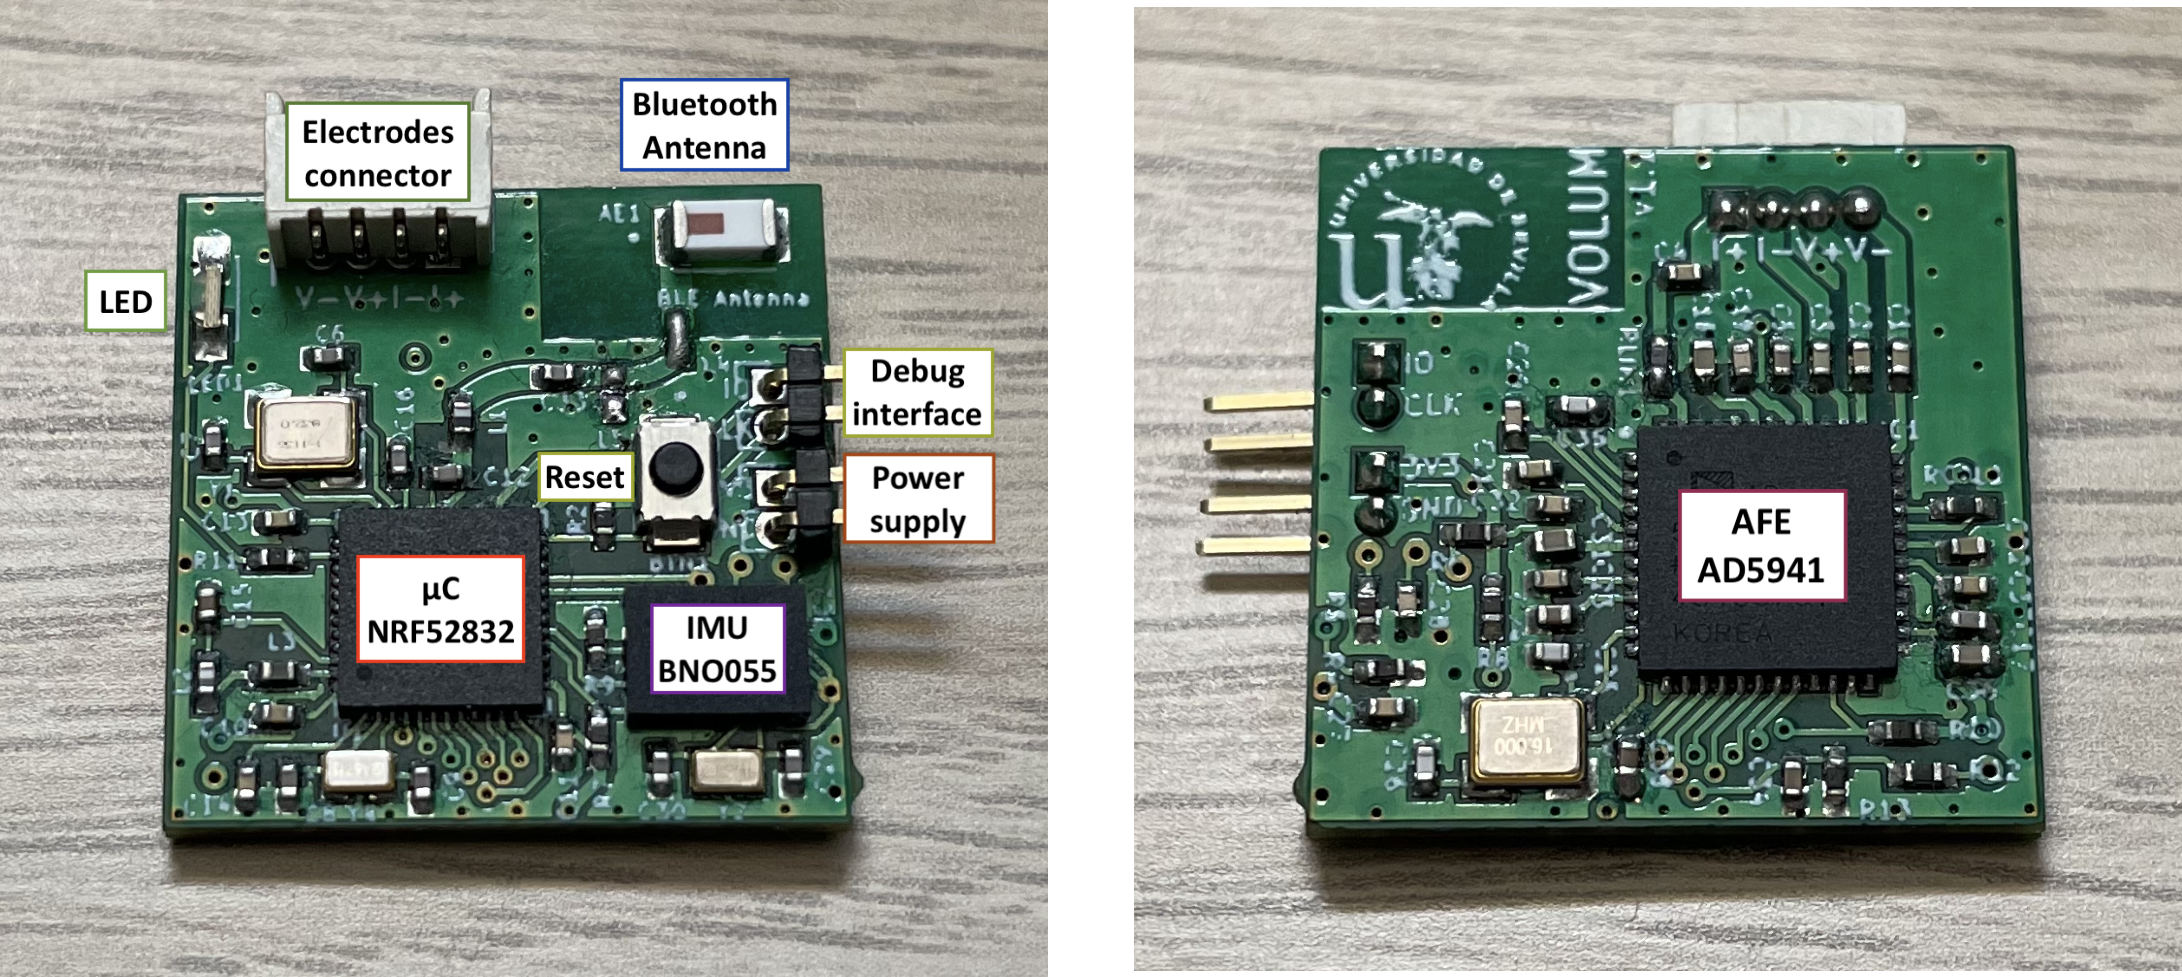
The VOLUM ankle-worn prototype during a bioimpedance measurement.

The VOLUM ankle-worn prototype during a bioimpedance measurement.

Santiago F. Scagliusi, Luis Giménez, Pablo Pérez, Daniel Martín, Alberto Olmo, Gloria Huertas, F. Javier Medrano, and Alberto Yúfera. Photograph from Figure 3a.

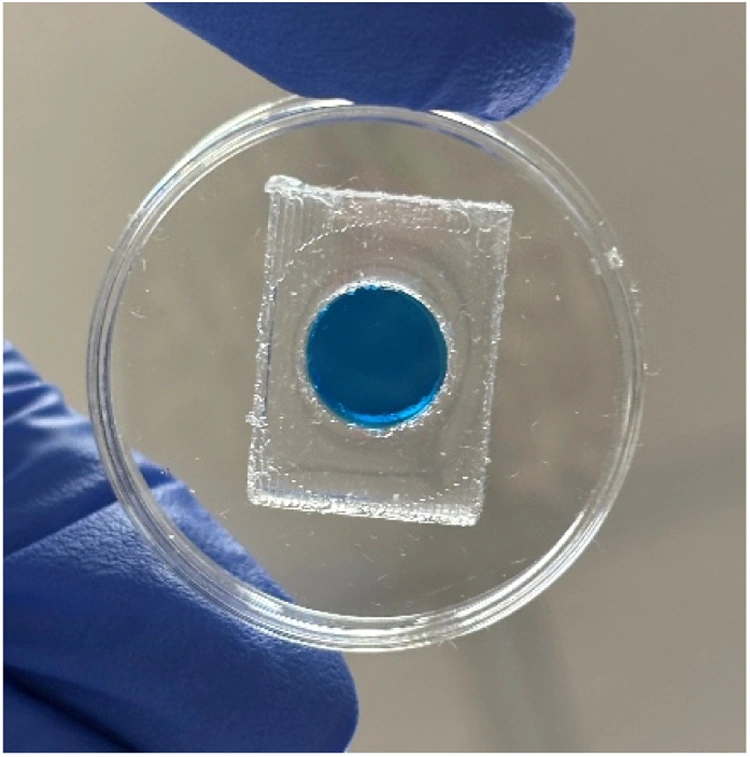
Leak test of a PDMS culture chamber in a 35 mm Petri dish.

Leak test of a PDMS culture chamber in a 35 mm Petri dish.

Antonio Algarín, Paula Lian Cabrera, Santiago F. Scagliusi, Paula Daza, Alberto Yúfera, and Daniel Martín. Figure 5 in full, converted to WebP.

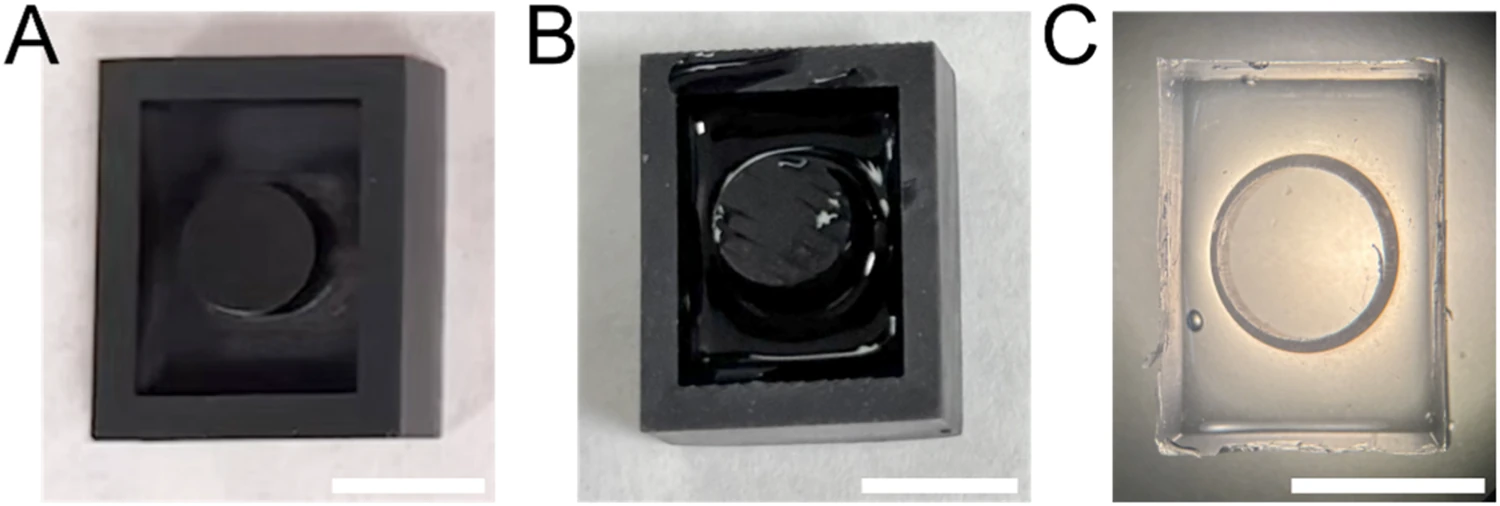
Three stages of an experimental culture well: the printed resin mould, the mould filled with PDMS and the finished well. Scale bar, 10 mm.

Three stages of an experimental culture well: the printed resin mould, the mould filled with PDMS and the finished well. Scale bar, 10 mm.

Antonio Algarín, Paula Lian Cabrera, Santiago F. Scagliusi, Paula Daza, Alberto Yúfera and Daniel Martín. Fig. 3

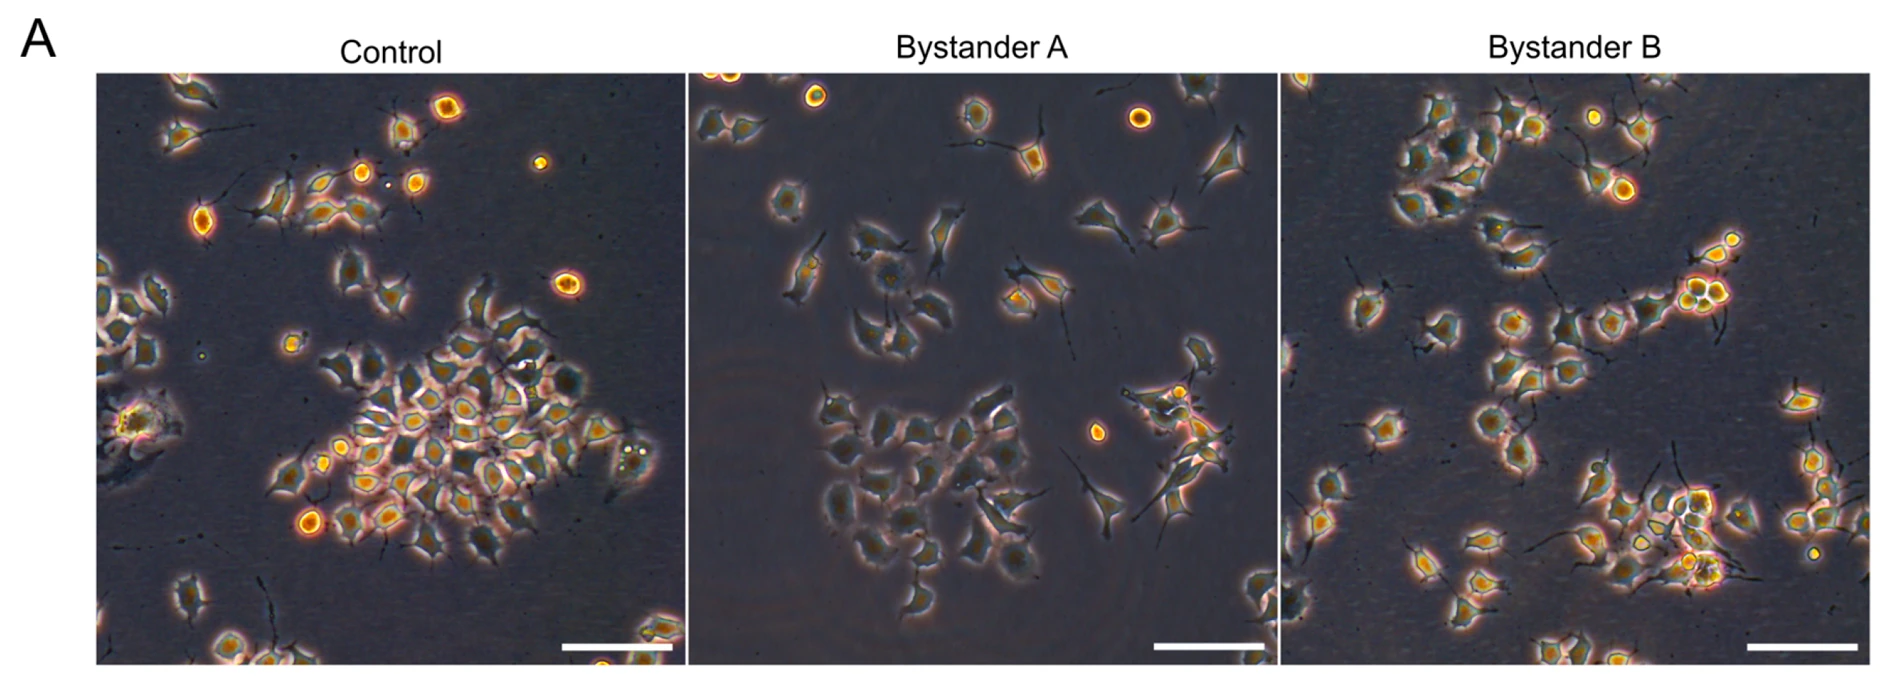
Phase-contrast images of mouse N2a cells. The control is compared with cultures exposed to medium collected immediately after stimulation (A) or 24 hours later (B). Scale bars, 50 µm.

Phase-contrast images of mouse N2a cells. The control is compared with cultures exposed to medium collected immediately after stimulation (A) or 24 hours later (B). Scale bars, 50 µm.

Daniel Martín, Luis Orta, Akaitz Dorronsoro, Diego Ruano, Alberto Yúfera and Paula Daza. Fig. 2A

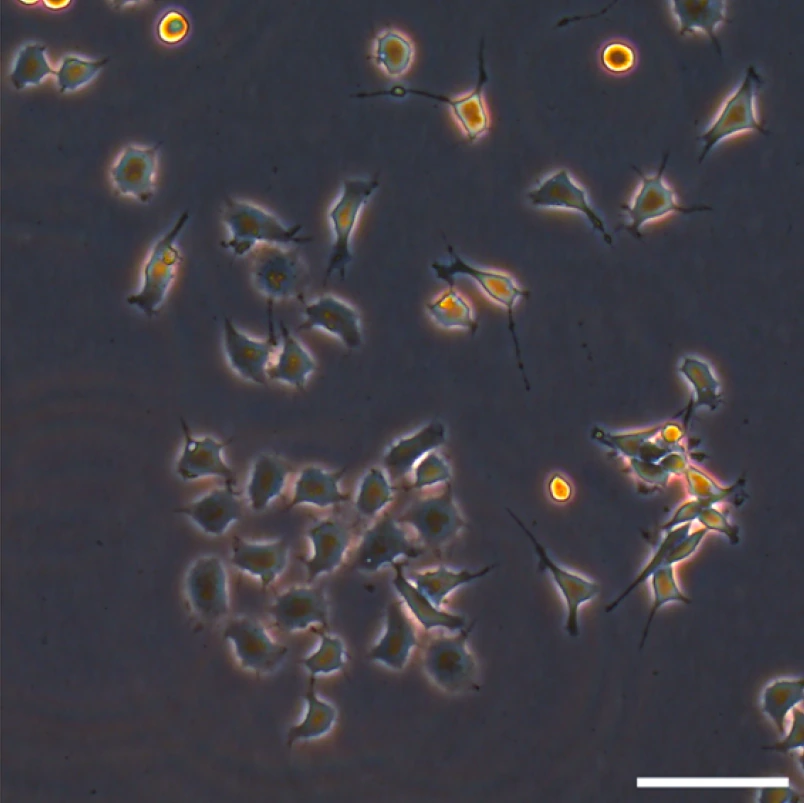
N2a cells receiving conditioned medium collected after electrical stimulation of another culture. Phase-contrast micrograph; scale bar, 50 µm.

N2a cells receiving conditioned medium collected after electrical stimulation of another culture. Phase-contrast micrograph; scale bar, 50 µm.

Daniel Martín, Luis Orta, Akaitz Dorronsoro, Diego Ruano, Alberto Yúfera and Paula Daza. Fig. 2A · detail

The cell-culture cartridge mounted on the wireless readout board.

The cell-culture cartridge mounted on the wireless readout board.

Pablo Pérez, Gloria Huertas, Alberto Olmo, Andrés Maldonado-Jacobi, Juan A. Serrano, María E. Martín, Paula Daza & Alberto Yúfera. Fig. 3b · detail

AA8 cells on a gold sensing microelectrode.

AA8 cells on a gold sensing microelectrode.

Pablo Pérez, Gloria Huertas, Alberto Olmo, Andrés Maldonado-Jacobi, Juan A. Serrano, María E. Martín, Paula Daza & Alberto Yúfera. Fig. 2b · detail

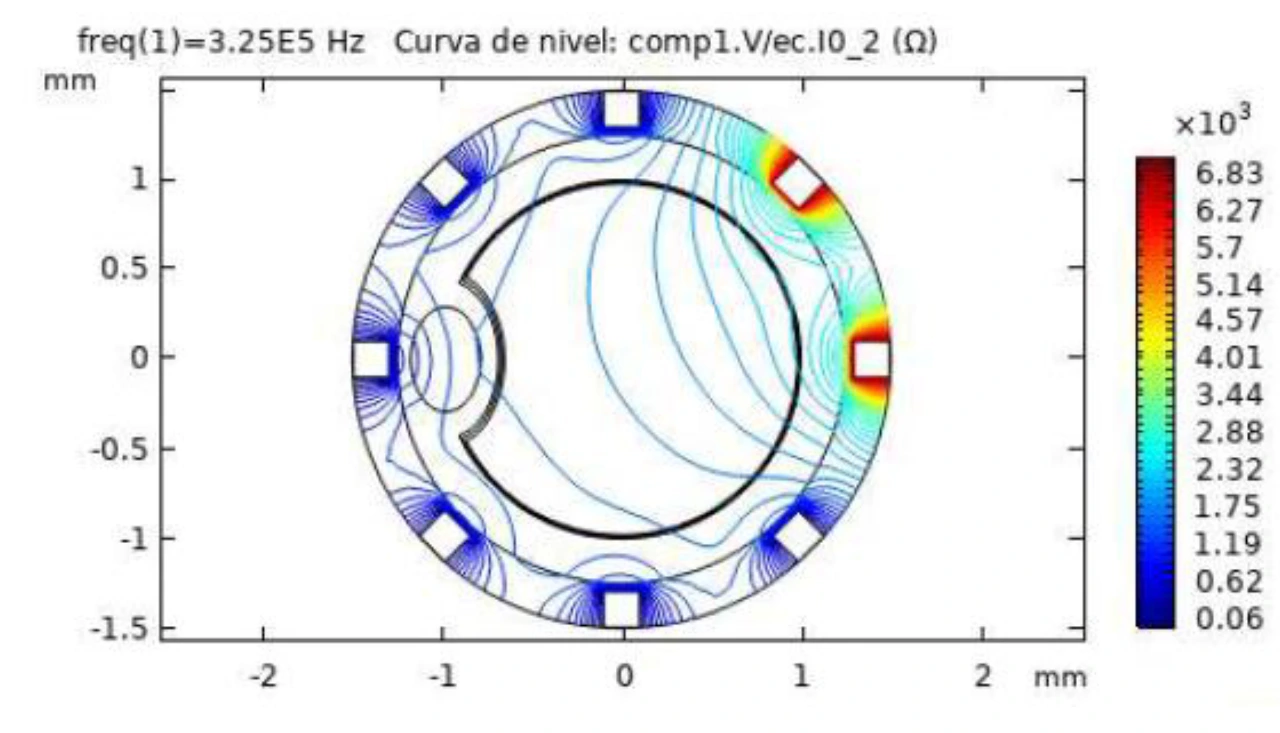
Computed impedance contours in an arterial cross-section with a simulated plaque.

Computed impedance contours in an arterial cross-section with a simulated plaque.

Antonio Rodríguez, Pablo Barroso, Alberto Olmo & Alberto Yúfera. Fig. 6 · detail

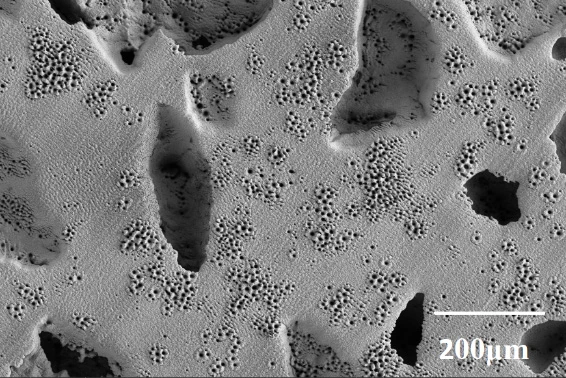
Scanning electron micrograph of a porous titanium specimen.

Scanning electron micrograph of a porous titanium specimen.

Paula Navarro, Alberto Olmo, Mercè Giner, Marleny Rodríguez-Albelo, Ángel Rodríguez & Yadir Torres. Fig. 1

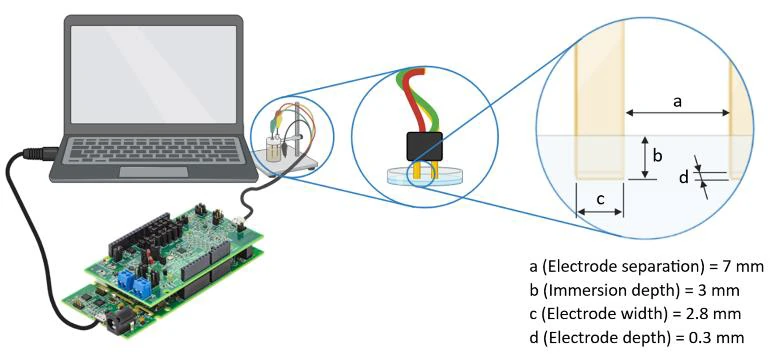
Experimental setup for measuring the impedance of cryoprotectant solutions.

Experimental setup for measuring the impedance of cryoprotectant solutions.

Enrique Alcalá, Alberto Olmo, Pablo Pérez, Santiago Fernández, Laura Encabo & Ramón Risco. Fig. 1

Assembled electrical stimulation system with culture wells fitted into the holder.

Assembled electrical stimulation system with culture wells fitted into the holder.

Daniel Martín Fernández. Fig. 2-11, cropped to the assembled system.

Author portraits

Five author portraits from Scagliusi et al., IEEE Access (2023) · CC BY-NC-ND 4.0. Santiago’s portrait: Santiago Fernández Scagliusi’s personal archive.